Historical Backtesting Audit & Verification
Learn how our algorithmic quantitative trading models are audited, backtested on historical data, and verified with rigorous Walk-Forward out-of-sample testing.
🏗️ 5.1 Walk-Forward Backtest Architecture
Every strategy in Kuni, US-Market Forecaster is subjected to automated backtesting engines. Click the screenshot below to inspect the audit report anatomy:
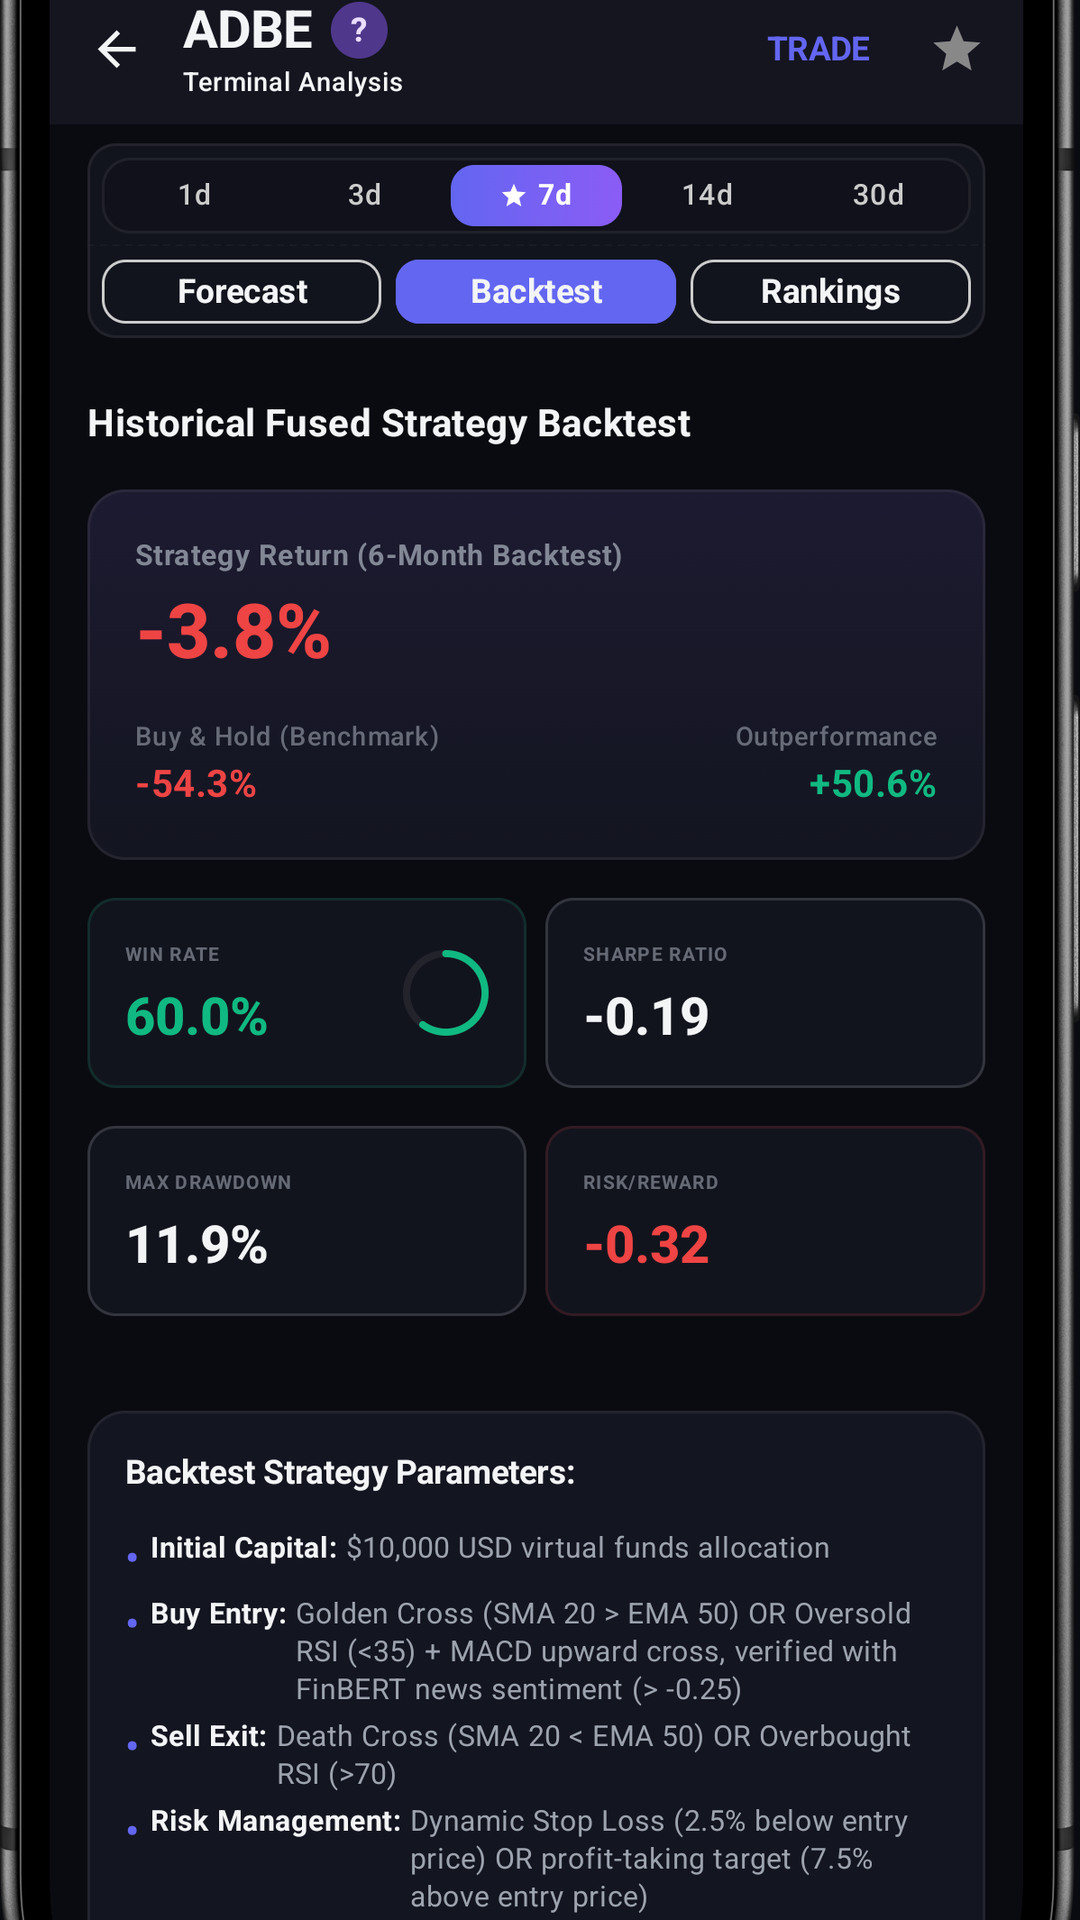
6-Month Lookback Window
Evaluates recent regime performance, capturing how the strategy adapted to recent interest rate shifts and macro earnings cycles.
2-Year Full Cycle Audit
Measures long-term robust alpha across both bullish rallies and bearish market corrections.
📐 5.2 Interpreting Key Backtest Metrics
Every backtest report generates five essential quantitative health metrics:
Strategy Return (e.g. +142.5%)
The total compounding return generated by following our algorithm's simulated entries, take-profit exits, and stop-losses over the lookback window.
Win Rate % & Trade Count (e.g. 74% (14W / 5L))
The percentage of executed trade cycles that closed in positive profit. A win rate between 60% and 75% indicates a highly disciplined strategy.
Sharpe Ratio (e.g. 2.14)
Measures risk-adjusted excess return per unit of volatility. A Sharpe ratio > 1.0 is good, > 2.0 is excellent, and > 3.0 is world-class.
Max Drawdown (e.g. -8.4%)
The largest peak-to-trough decline experienced by the strategy. Tightly controlled drawdowns protect your capital from catastrophic losses.
Outperformance vs Buy-and-Hold
Calculates whether our active quantitative signal engine generated excess Alpha compared to simply holding the stock passively.
🏛️ 5.3 Wall Street vs TimesFM AI Targets
To provide a balanced perspective between artificial intelligence and institutional human analysts, the Backtest screen integrates the latest Wall Street consensus data:
Low Target
The most conservative valuation estimate published by institutional research firms (Bear case).
Mean Target
The consensus average 12-month price target compiled from dozens of Wall Street equity research desks.
High Target
The most optimistic 12-month price target published by top-tier investment banks (Bull case).
🛡️ 5.4 Audit Rigor & Anti-Overfitting Safeguards
How does the app guarantee that historical backtests are honest and realistic?
- Zero Lookahead Bias: Signals at time
Tare evaluated strictly using data available up toT. - Slippage & Spread Simulation: All executions factor in routine bid-ask spread friction.
- Point-in-Time Splits: Training data and evaluation backtest intervals are strictly isolated.