Dashboard & Market Signals Master Guide
The Dashboard is the central command center of Kuni, US-Market Forecaster. It provides real-time market surveillance, artificial intelligence signals, multi-horizon forecasts, and automated opportunity scanning across all US equities.
📱 2.1 Dashboard Layout & Components
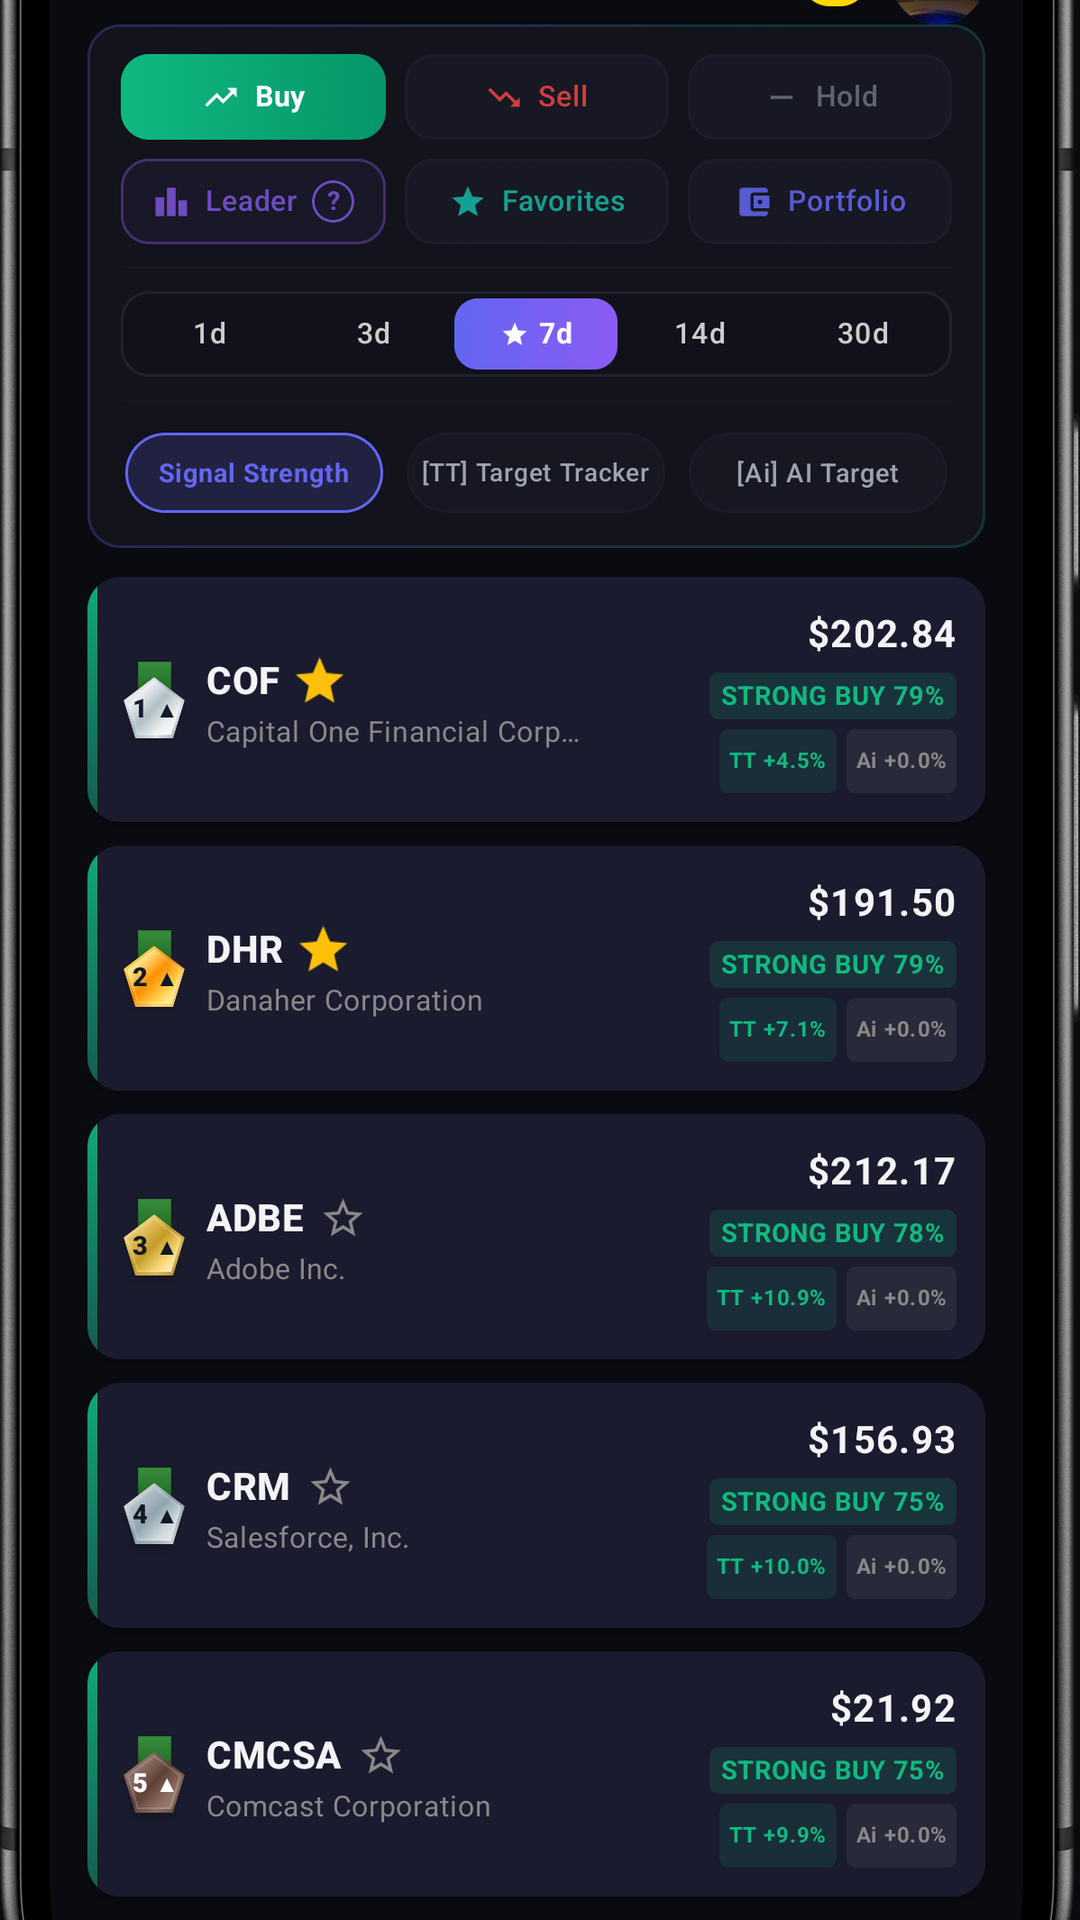
When you open the app, the Dashboard presents a clean, high-contrast interface. Click the screenshot below to zoom in high resolution:
Top App Bar & Live Search
Search any stock ticker (e.g. AAPL, NVDA, TSLA, MSFT) instantly, view the current market scanning session status, and access the navigation drawer menu.
Primary Navigation Tabs
Toggle between Buy, Hold (Neutral), Sell, Leaderboard, Favorites, and Portfolio.
Time Horizon Chips (1D – 90D)
Switch forecasting horizons seamlessly: 1D (Intraday), 3D, 7D (Weekly Swing), 14D, 30D (Monthly), and 90D (Macro).
Sort & Filter Bar
Sort stock cards by Signal Strength, Target Tracker distance, AI Price Target percentage, or 2-Year Strategy Return with one tap.
🎛️ 2.2 Interactive Signal Decay Simulator
In quantitative trading, signals are dynamic: as a stock rises toward its target, the remaining profit potential decays. Try the live interactive simulator below to see how the app transitions stock cards in real time:
🚦 2.3 Three Core Signal Tabs (Buy, Hold, Sell)
Every scanned US stock is classified into one of three dynamic categories based on quantitative models and AI predictions:
🟢 BUY Tab (High Probability Bullish Opportunities)
Displays stocks where the combined AI neural forecast and technical momentum models project strong upward price movement. These cards feature green badges, high confidence percentages (e.g. BUY 85%), and positive take-profit targets.
🔵 HOLD / NEUTRAL Tab (Consolidation & Reached Targets)
Contains stocks in consolidation phases, sideways ranges, or assets that have already reached their profit targets and are decaying into equilibrium. This tab protects you from buying at the top of an exhausted rally.
🔴 SELL Tab (Bearish Trajectories & Downside Alerts)
Highlights stocks showing significant technical breakdown, bearish candlestick divergences, negative sentiment, or downward neural forecasts. Serves as a critical risk mitigation warning to protect capital.
🃏 2.4 Anatomy of a Stock Signal Card
Elements on Every Card:
- Rank Medal (🥇 / 🥈 / 🥉 / #N): Represents the stock's relative rank within the currently selected tab and horizon, sorted by composite Signal Strength.
- Ticker Symbol & Company Name: Tap anywhere on the card to open the comprehensive Stock Detail Screen.
- Live Market Price & Daily % Change: Real-time pricing color-coded green (gain) or red (loss).
- Signal Badge (e.g.
BUY 88%): The algorithmic signal and its probability confidence score. - Target Tracker Pill (
[TT +7.8%]): Percentage distance remaining until the stock hits its algorithmic profit target. - AI Target Pill (
[Ai +12.4%]): The pure expected median return projected by the Google TimesFM 2.5 foundation model. - Strategy Return Badge (
[2Y: +142.5%]): The audited 2-year backtest return achieved by our trading algorithm on this specific asset. - Star Icon (⭐): Tap the star on the right side of the card to instantly add or remove the stock from your private Watchlist / Favorites.
⏱️ 2.5 Multi-Interval Horizons (1D to 90D)
Different trading styles require different time perspectives. The horizontal chip bar at the top of the dashboard allows instant switching between 6 distinct forecasting windows:
| Horizon Chip | Trading Style | What It Analyzes | Best For |
|---|---|---|---|
| 1D | Intraday / Day Trading | Next-session price momentum, gap fills, and opening volatility. | Day traders looking for quick 1-2% scalps. |
| 3D | Short-Swing | Multi-day momentum continuation after catalyst events. | Catching 2-3 day trend waves. |
| 7D (Default) | Weekly Swing | Full weekly market cycle, primary support/resistance retests. | Core recommended horizon for most retail investors. |
| 14D | Bi-Weekly Swing | Two-week trend channel stability and moving average crosses. | Swing traders managing larger position sizes. |
| 30D | Monthly Trend | Monthly directional momentum and sector rotation trends. | Position traders and monthly rebalancers. |
| 90D | Macro / Quarterly | Quarterly earnings drifts, fundamental valuations, and macro cycles. | Long-term portfolio allocators. |
📘 2.6 Real-World Trading Playbooks
Playbook 1: The Earnings Season Setup
Goal: Capture post-earnings drift without gambling on binary reports.
Method: Filter Leaderboard by 30D AI Target + News+SEC Sentiment > +0.40. Look for companies with AAA EPS Momentum. Enter positions only AFTER the earnings call when guidance confirmation is published.
Playbook 2: Flash Crash Capital Defense
Goal: Protect your portfolio when macro headlines cause a market-wide drop.
Method: Open the Portfolio tab. If any stock closes below its P10 Stop-Loss Floor on the detail chart, execute an immediate sell to preserve capital. Never average down on a broken P10 floor.
Playbook 3: 1D Scalping vs 7D Swing
Goal: Choose the right horizon for your daily schedule.
Method: If you cannot watch the screens continuously during market hours, strictly stick to the 7D and 14D horizons. 1D signals require active intraday monitoring at the 09:30 ET opening bell.
🛡️ 2.7 Banners & Status Indicators
The dashboard communicates operational states transparently to ensure you never trade on outdated information:
🟡 Stale Data / Offline Banner
Appears when your device is offline or cannot reach market servers. The app informs you: "You are viewing cached data because the network is unreachable. Prices may be outdated." Your saved portfolio and watchlist remain 100% accessible.
🔵 Market Scanning Banner
Shows the current US market status (e.g. "Market Open: Regular Session", "Pre-Market", or "Market Closed: Weekend") along with a countdown timer to the next scheduled scan run.