AI Forecast Charts & Confidence Bands
The Stock Detail screen is your algorithmic deep-dive suite, powered by Google TimesFM 2.5 neural foundation models and multi-source technical aggregation.
📈 3.1 Stock Detail Screen Anatomy
Every detail page combines live OHLCV price feeds, interactive neural forecast envelopes, historical backtesting audits, and real-time news sentiment. Click the screenshot below to zoom:
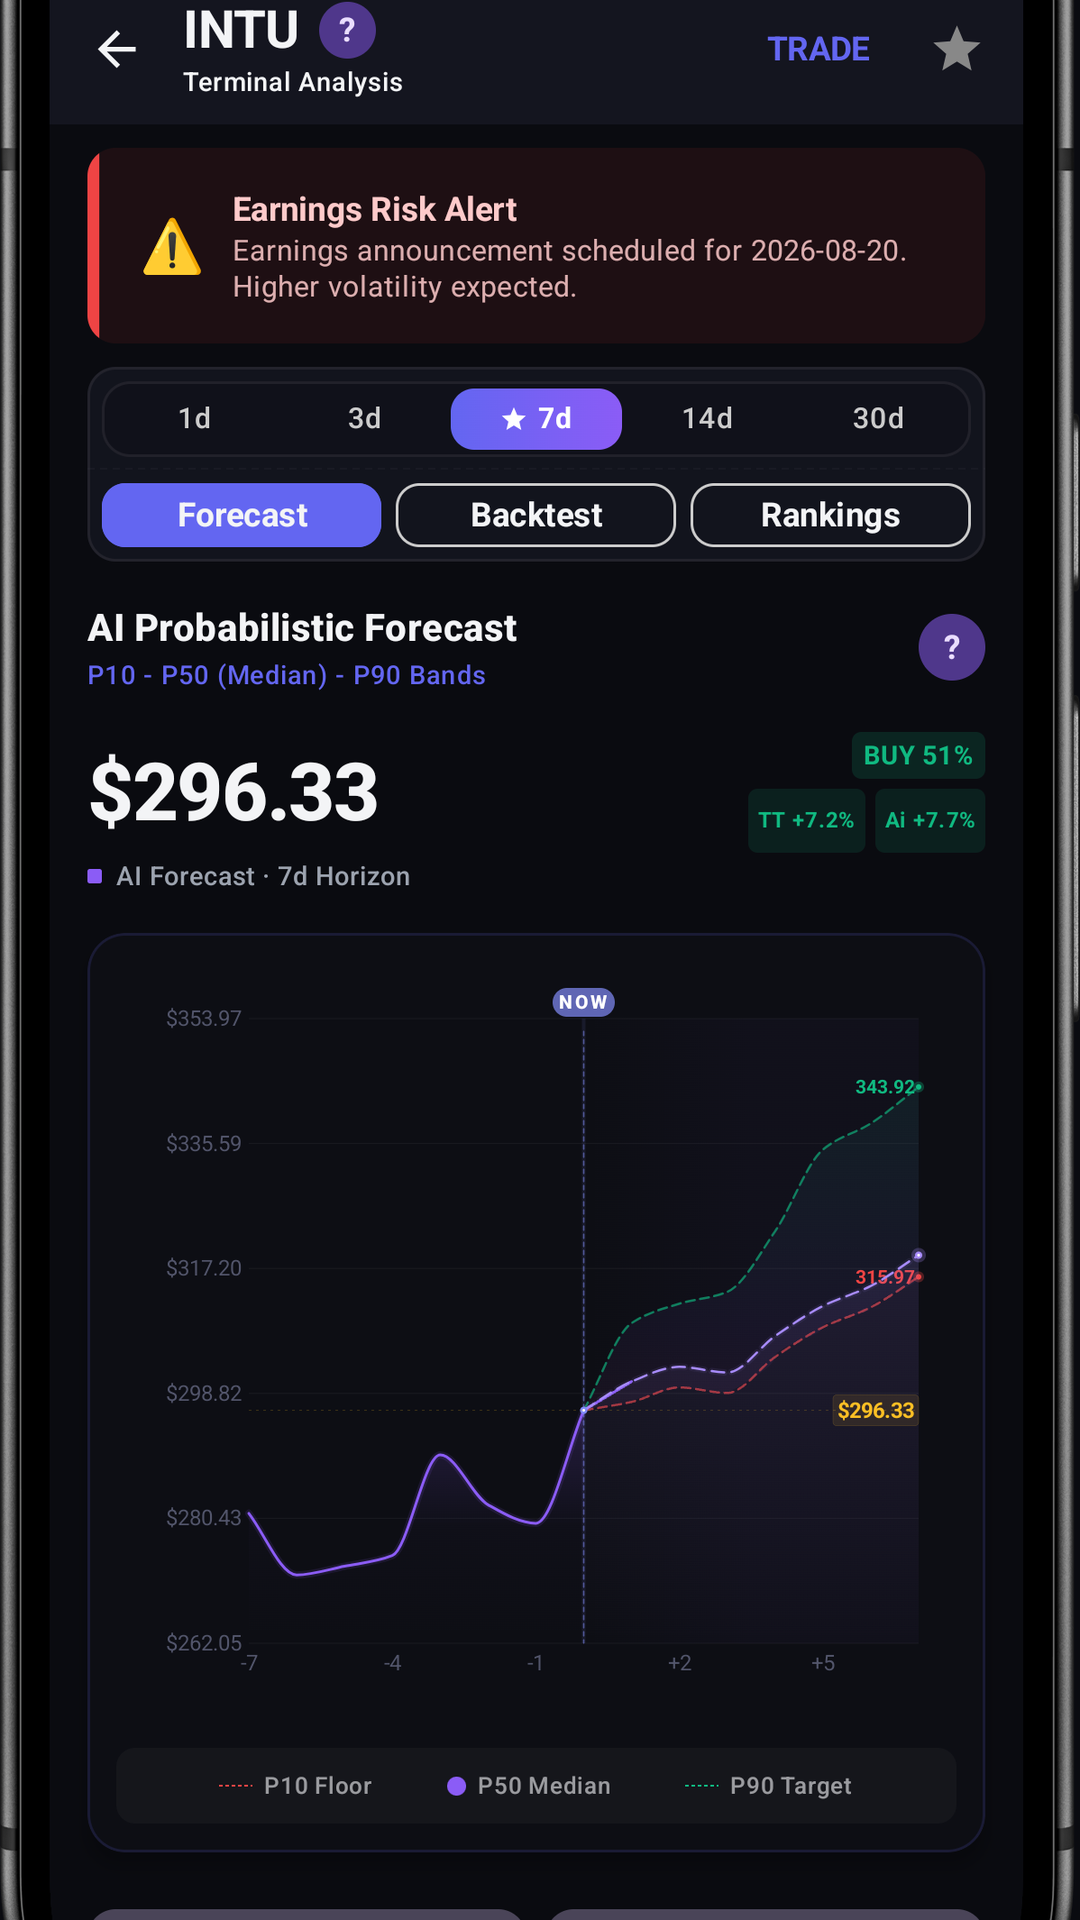
Forecast Tab (Default)
Displays the interactive AI forecast chart, past price history, probabilistic future envelopes (P10/P50/P90), and key valuation multiples.
Backtest Tab
Shows the 6-Month and 2-Year audited strategy return, win rate, maximum drawdown, Sharpe ratio, and Wall Street analyst consensus targets.
Rankings Tab
Ranks the selected company within its specific industry and sector across momentum, valuation, earnings growth, and volatility metrics.
🎛️ 3.2 Probabilistic Corridor Simulator
Try switching horizons below to see how Google TimesFM 2.5 calculates probabilistic uncertainty bands over time:
Select Forecast Horizon:
🔍 3.3 Reading AI Probabilistic Charts
The centerpiece of the screen is the custom high-performance forecast canvas:
🟢 P90 Target (Ceiling / Optimistic Boundary)
Upper green dashed boundary. Statistically, there is a 90% probability that the price will trade below or up to this ceiling. In the app, P90 serves as the automated AI Profit-Taking Target. When a stock reaches P90, taking profits is mathematically recommended.
🔵 P50 Path (Expected Trajectory / Central Median)
Middle blue solid line. This is the single most statistically probable central price trajectory calculated by Google TimesFM. The difference between the live price and P50 at the horizon is your AI Price Target (Q50) return.
🔴 P10 Floor (Support / Pessimistic Boundary)
Lower red dashed boundary. Statistically, there is a 90% probability that the price will remain above this floor. If market conditions deteriorate and price falls through the P10 floor, the bullish thesis is invalidated. P10 serves as your Dynamic Algorithmic Stop-Loss.
📊 3.4 Time Horizon Accuracy & Curves
Why do the forecast bands become wider as you increase the forecasting period?
| Horizon | Band Width | Accuracy Profile | How to Trade It |
|---|---|---|---|
| 1 - 7 Days | Narrow | Highest Reliability | Short-term price momentum, order flow, and technical indicator alignment dominate. Tight stop-loss and profit target execution. |
| 14 Days | Medium | Good Trend Reliability | Trend continuation across multi-day swing positions. Bands widen moderately to absorb routine market pullbacks. |
| 30 Days | Wide | Directional Trend | External macro risks and economic news begin to introduce uncertainty. Use as a directional channel rather than an exact price target. |
| 90 Days | Broad | Macro Cycle | Captures fundamental corporate earnings drift and broader market rotation cycles. |
📋 3.5 Key Financial Metrics on Detail Screen
Below the forecast chart, the screen displays essential financial fundamentals to help you evaluate the company's financial health:
- Market Cap: Total market value of all outstanding shares (Mega-Cap > \$200B, Large-Cap > \$10B, Mid-Cap \$2B–\$10B).
- P/E Ratio (Price-to-Earnings): Valuation multiple comparing share price to earnings per share.
- PEG Ratio (P/E to Growth): P/E divided by earnings growth rate. A PEG below
1.0suggests an undervalued growth stock. - Beta (Volatility Correlation): Measures how much the stock moves relative to the S&P 500. Beta >
1.0means higher volatility; Beta <1.0means lower volatility. - 52-Week Range (Low / High): Visual slider showing where current price sits relative to its past 52-week trading channel.
- Average Volume (30D): 30-day daily trading volume, confirming institutional liquidity.
⚡ 3.6 The "TRADE" Action Button
At the bottom of the Detail Screen, you will find the prominent floating TRADE button. Tapping it opens the Simulated Trade Dialog, allowing you to instantly buy or sell shares using your virtual portfolio balance without risking real capital.
💡 One-Tap Workflow
When you discover a high-conviction BUY 85% signal with a favorable P10/P90 risk-reward setup, tap TRADE, choose your share quantity, and test your strategy inside the private portfolio simulator!