Market Leaderboards & Sorters Guide
A comprehensive overview of all 18 quantitative ranking models, statistical risk filters, institutional volume metrics, and real-world trading playbooks.
🏆 7.1 Top 100 Leaderboards Overview
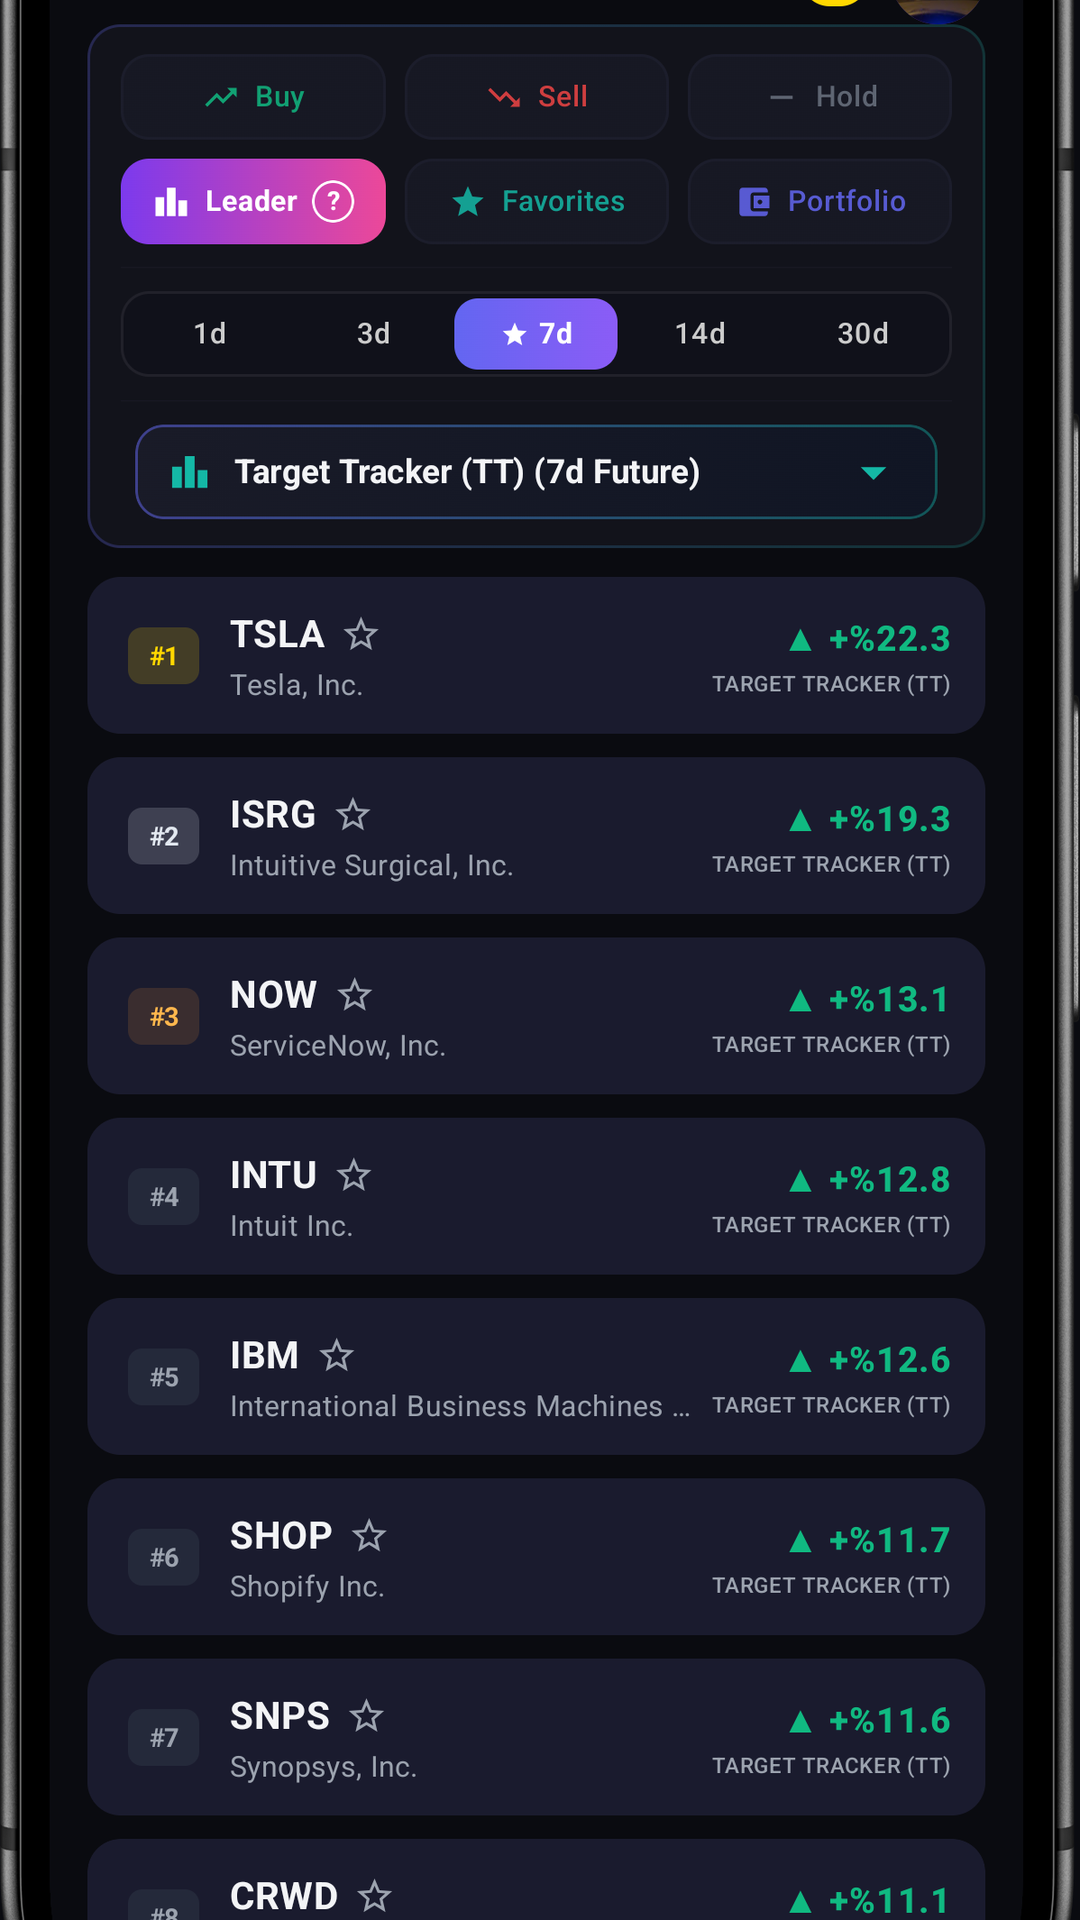
The Leaderboard tab scans and dynamically ranks hundreds of tracked US equities across multi-interval horizon profiles (1D, 3D, 7D, 14D, 30D). Rather than relying on a single static score, the engine offers 18 distinct quantitative perspectives to match your investment style.
🔢 7.2 The 18 Quantitative Ranking Categories
Each ranking category provides a tailored lens to evaluate market opportunities across 5 quantitative domains:
| # | Ranking Category | Focus Area | What It Evaluates | Best Suited For |
|---|---|---|---|---|
| 1 | AI Forecast Risk/Reward | AI + Trade Setup | Expected upside to target relative to projected downside risk based on the AI forecast corridor. | Asymmetric risk/reward setups seeking high capital efficiency. |
| 2 | Signal Strength Composite | AI + Momentum | Overall signal confidence combining neural price trajectory with multi-indicator momentum confirmation. | High-probability trade setups with dual technical and AI alignment. |
| 3 | Target Tracker % (TT) | Opportunity Space | Remaining percentage potential from current live price to the projected target level. | Identifying fresh setups in early stages before significant price movement occurs. |
| 4 | AI Price Target % (Q50) | Neural Projection | Expected percentage return based on the median forecast trajectory of the AI model. | Direct AI projection trading based on statistical median expectations. |
| 5 | Sharpe Ratio (2Y) | Risk-Adjusted Return | Excess historical performance generated relative to volatility and market swings over 2 years. | Smooth equity curves with minimal volatility and steady compounding. |
| 6 | Backtest Risk/Reward (2Y) | Historical Payoff | Realized average win size compared to average loss size across all historical closed trades. | Strategies where winners substantially outweigh losing trades. |
| 7 | Max Drawdown (2Y) | Capital Protection | Smallest historical peak-to-trough drop recorded across market pullbacks (sorted lowest to highest). | Defensive portfolios, capital preservation, and drawdown minimization. |
| 8 | Strategy Return (2Y) | Cumulative Profit | Total compounded historical net return generated by following algorithmic signals over 24 months. | Stocks with proven long-term outperformance under model guidance. |
| 9 | Win Rate % (2Y) | Consistency & Reliability | Percentage of historical trade signals that concluded at a net profit during backtesting. | Traders seeking high statistical reliability and frequent positive outcomes. |
| 10 | Buy & Hold Benchmark (2Y) | Baseline Comparison | Unmanaged 2-year buy-and-hold baseline return used to evaluate active signal alpha. | Identifying long-term secular bull market leaders and testing strategy outperformance. |
| 11 | Smart Money Flow / Insiders | Institutional Activity | Composite indicator tracking corporate insider transactions and institutional hedge fund accumulation. | Following high-conviction insider buying and institutional whale positioning. |
| 12 | Volume Confirmation | Volume Spikes | Relative increase in daily trading volume compared to the 30-day baseline average. | Detecting institutional accumulation and breakout volume confirmation. |
| 13 | Average Volume (30D) | Liquidity & Depth | 30-day average daily share volume indicating order book depth and ease of trade entry/exit. | Ensuring minimal slippage, tight bid-ask spreads, and instant trade execution. |
| 14 | News & SEC Sentiment | NLP Analysis | Language sentiment analysis across financial media, earnings transcripts, and regulatory filings. | Capitalizing on positive fundamental news flow and narrative momentum. |
| 15 | Operational EPS Momentum | Earnings Growth Tiers | Sequential acceleration in core operational earnings categorized into distinct performance tiers. | High-growth equity selection driven by accelerating corporate profitability. |
| 16 | Wall Street Target Mean | Analyst Consensus | Consensus 12-month upside potential projected by major Wall Street equity research analysts. | Identifying deeply undervalued stocks with strong institutional analyst backing. |
| 17 | Technical Composite Score | Classic Indicators | Standardized momentum score evaluating RSI, MACD, Stochastics, EMAs, and Bollinger Bands. | Chart-based breakout and trend-following strategies. |
| 18 | By Sector & Industry Allocation | Macro & Micro Grouping | Equities organized by industry sector and sub-industry cards, ordered by strongest signal strength. | Sector rotation, portfolio diversification, and industry leadership analysis. |
🤖 7.3 Deep Dive: AI & Predictive Rankings
These ranking models leverage deep probabilistic time-series forecasting to identify optimal entry points and profit targets:
1. AI Forecast Risk/Reward Ratio
Measures the balance between projected profit potential and downside risk based on the neural forecast corridor.
- Above 1.0 (Green): Attractive setup where expected gain exceeds estimated risk.
- Below 1.0 (Red): Unfavorable payoff balance where risk outweighs expected reward.
- Key Advantage: Helps traders focus only on high-margin, capital-efficient opportunities.
2. Signal Strength Composite
Combines multi-interval forecast trajectories with technical momentum filters and stability checks.
- Hierarchy: High-Confidence BUY → Moderate BUY → NEUTRAL → SELL.
- Dynamic Updates: Automatically recalculates across 1-day, 3-day, 7-day, 14-day, and 30-day horizons.
- Key Advantage: Provides a single, clear measure of algorithmic confidence.
3. Target Tracker % (TT)
Measures the remaining percentage distance between the current market price and the projected take-profit target.
- Early Opportunity: High positive TT indicates a setup in its early stages with full upside remaining.
- Late Stage: Low or near-zero TT indicates the move has already matured.
- Key Advantage: Prevents chasing extended stocks and spots fresh setups early.
4. AI Price Target % (Q50)
Represents the statistical median price trajectory produced by the neural forecasting model for the selected horizon.
- Median Trajectory: Reflects the balanced center-point of the probabilistic forecast.
- Multi-Horizon View: Compare short-term moves against medium-term trend expectations.
- Key Advantage: Clear percentage expectation for potential price appreciation.
📊 7.4 Deep Dive: 2Y Backtest & Risk Rankings
Audited across 500+ historical sessions to verify empirical robustness across bull and bear cycles:
5. Sharpe Ratio (2-Year)
Evaluates how much return a stock produced per unit of price fluctuation and risk taken.
- Above 1.0 (Green): High quality of returns with well-controlled volatility.
- Below 0.0 (Red): Inadequate returns relative to high price swings.
- Key Advantage: Ideal for building steady, low-stress compound growth portfolios.
6. Backtest Risk/Reward Ratio (2Y)
The realized ratio of average winning trade percentage to average losing trade percentage over 24 months.
- Highlights stocks where winning trades produce significantly larger gains than losses.
- Provides confidence that long-term mathematical expectancy is positive.
7. Max Drawdown % (2Y)
The largest historical peak-to-trough decline experienced during market pullbacks. Ranked from lowest to highest.
- Under 15% (Green): Highly resilient stock during broader market downturns.
- Key Advantage: Essential filter for risk-averse investors and defensive allocations.
8. Strategy Return % (2Y)
Cumulative compounded net performance generated by strictly executing all model signal entries and exits.
- Shows which stocks have responded best to algorithmic signals over time.
- Calculated using strict out-of-sample walk-forward backtest simulation.
9. Win Rate % (2-Year)
Measures the empirical percentage of historical simulated trade signals that closed at a net profit over 500+ sessions.
- Above 50% (Green): Indicates a solid statistical edge and dependable trade execution.
- Trade Volume Context: Evaluated alongside total historical trade counts (e.g. 14W / 5L).
- Key Advantage: Prioritizes repeatable consistency and eliminates dependency on rare lucky windfalls.
10. Buy & Hold Benchmark Return (2Y)
The unmanaged 2-year buy-and-hold capital performance of the underlying stock without active signal timing.
- Alpha Measurement: Direct comparison against Strategy Return to verify genuine active model alpha.
- Regime Context: Distinguishes market-wide beta tailwinds from algorithmic selection skill.
- Key Advantage: Pinpoints secular compounders and validates active quantitative timing.
💼 7.5 Deep Dive: Smart Money & Volume Rankings
Track institutional footprint, corporate insider accumulation, and unusual trading liquidity:
11. Smart Money Flow / Insiders
Monitors corporate insider open-market purchases alongside quarterly institutional hedge fund position changes.
- High Score (Green >= 70): Strong executive buying and institutional accumulation.
- Low Score (Red <= 35): Notable insider selling or institutional distribution.
- Key Advantage: Aligns your portfolio with high-conviction smart money participants.
12. Volume Confirmation
Identifies unusual surges in daily trading activity relative to the stock's standard 30-day baseline average.
- Significant volume spikes often precede or accompany major trend initiations.
- Helps confirm whether a price move has institutional participation behind it.
13. Average Volume (30-Day)
Tracks the 30-day baseline average daily traded share volume, displayed in formatted Millions (M) or Thousands (K).
- High Liquidity (Green >= 100K): Deep institutional order books allowing seamless entry and exit with minimal slippage.
- Low Liquidity (Red < 100K): Thin order books where larger position sizes may face execution friction.
- Key Advantage: Critical liquidity filter to ensure capital mobility and tight bid-ask spreads.
📰 7.6 Deep Dive: NLP Sentiment & Earnings Rankings
Scan narrative sentiment, fundamental corporate earnings momentum, and Wall Street analyst targets:
14. News & SEC Sentiment Score
Natural Language Processing scanning financial news wires, press releases, and regulatory filings.
- Bullish Sentiment (Green > +0.15): Positive media coverage and favorable business developments.
- Cautionary Sentiment (Red < -0.15): Negative headlines, regulatory inquiries, or lowered outlooks.
- Key Advantage: Detects narrative shifts before they are fully reflected on price charts.
15. Operational EPS Momentum
Classifies sequential acceleration in core operational earnings into standardized quality tiers.
- AAA Tier (Green): Exceptional earnings expansion and accelerating profitability.
- BBB Tier (Indigo): Healthy, steady double-digit earnings growth.
- CCC Tier (Orange): Moderate or plateauing earnings.
- X Tier (Red): Contracting earnings or operating losses.
16. Wall Street Target Mean Price
Consensus 12-month average target price compiled from dozens of institutional Wall Street equity research desks.
- Positive Spread (Green): Current market price trades at a substantial discount to analyst consensus.
- Negative Spread (Red): Stock has extended beyond consensus price targets.
- Key Advantage: Complements quantitative AI forecasts with institutional analyst research consensus.
📈 7.7 Deep Dive: Technical & Sector Groupings
Aggregate classical chart indicators or cluster stocks across macro sectors and granular industries:
17. Technical Composite Score
Combines multiple widely-used indicators into a unified 0–100 technical momentum rating.
- Above 60 (Green): Strong technical alignment and upward momentum.
- Below 40 (Red): Weakened technical structure or oversold conditions.
- Key Advantage: Provides a quick chartist snapshot without cluttering price screens.
18. By Sector & Industry Allocation View
Organizes stocks into expandable Sector and Industry group cards, dynamically ordering equities inside each group by signal strength.
- Macro Sector Taxonomy: Compare broad market sectors (Technology, Healthcare, Energy, Financials, etc.).
- Micro Industry Grouping: Drill into sub-sector industries (Semiconductors, Biotechnology, Software Infrastructure).
- Key Advantage: Identifies leading market sectors and pinpoints the strongest alpha stock in each cluster.
🎯 7.8 Strategy Matcher & Trading Playbooks
Combine complementary ranking categories to match your specific investment goals and risk tolerance:
Breakout & Momentum Setup
Primary Focus: Target Tracker (%)
Secondary Filter: Volume Confirmation
Identifies early-stage setups showing abnormal trading volume before major resistance breakouts.
Steady Growth & Capital Defense
Primary Focus: Sharpe Ratio (2Y)
Secondary Filter: Max Drawdown (2Y)
Builds a resilient, low-volatility portfolio designed to minimize pullbacks during market corrections.
Institutional & Insider Alignment
Primary Focus: Smart Money Flow
Secondary Filter: News & SEC Sentiment
Highlights stocks where company leaders and major funds are accumulating positions ahead of catalysts.
Fundamental Value & Analyst Upside
Primary Focus: Wall Street Target Mean
Secondary Filter: Operational EPS (AAA Tier)
Uncovers fundamentally solid growth companies trading at substantial discounts to consensus price targets.
👑 7.9 Membership Tiers & Horizons
The Leaderboard provides flexible access across all ranking categories for all users:
🔒 Tier Access Overview:
- Free Tier Access: Browse all 18 ranking categories with full visibility of positions #4 through #100 across 1-day, 3-day, and 7-day horizons.
- Gold Premium: Unlocks the top 3 ranked leaders in every category along with extended medium-term 14-day and 30-day forecast horizons.
- Instant Sorting: Switch categories and intervals on the fly with zero calculation lag.
💖 7.10 Supporter Community Leaderboard
Located in the Navigation Drawer under "Support the Developer 👑", the community leaderboard honors supporters who help maintain market scanning infrastructure:
1. In-App Supporter Recognition
Community members can contribute voluntary tips through Google Play Billing to support cloud computing costs.
2. Supporter Badges
Top supporters receive honor badges (👑, 🥇, 🥈, 🥉) on the global in-app supporter board.
3. Privacy Controls
Supporters can choose to display their full name, first name only, or remain completely anonymous.